aimux: A Control Plane for AI Agent Swarms
When you're running multiple AI coding agents across terminals, you lose track of what each one is doing. aimux multiplexes them into a single dashboard with full visibility, trace inspection, and annotation for evaluation.
github.com/zanetworker/aimux - source code, install instructions, and docs.
The problem
Claude Code is refactoring auth in one terminal. Codex is rewriting tests in another. Gemini is generating docs in a third. A fourth session is idle. A fifth is stuck on a permission prompt. You don’t know, because each one lives in its own tab with its own logs and its own trace format.
The agents themselves have gotten pretty good. Knowing what five of them are doing at the same time? Not so much.
A fair question at this point: why would you run multiple coding assistants at the same time? Two reasons. First, it’s not always different agents. Most of the time it’s multiple instances of the same one. Three Claude Code sessions across three projects, each doing its own thing. Second, different agents are genuinely better at different tasks. I use Codex to peer-review Claude’s output sometimes, or run the same task on both to compare. Gemini handles certain writing tasks differently. It’s less about brand loyalty and more about using whatever works for the job at hand.
I kept hitting the visibility problem while doing this. Tab-switching to check status, grepping through JSONL logs to figure out what happened three turns ago, forgetting which agent was blocked on what. It felt like running a bunch of microservices with no observability layer.
What aimux does
aimux is a terminal multiplexer for AI coding agents. One Go binary, no daemon, no browser. Run it and you get a live dashboard of every running agent across providers (Claude Code, Codex, Gemini CLI) with status, model, token count, cost, and working directory. It polls the process table and session files every two seconds.
Press Enter on any agent and you get a split view: conversation trace on the left, interactive session on the right. You can read through the full turn-by-turn history (prompts, responses, tool calls with success/failure) while the agent keeps working next to it.
Discovery without hooks
aimux doesn’t need plugins or modifications to your agent tools. It finds running agents by scanning processes (ps aux), walking the PPID chain to catch subagents, and matching session files to processes by comparing start times with log timestamps. It reads Claude’s JSONL, Codex’s conversation files, and Gemini’s JSON traces, then normalizes them into one format.
If one provider fails (say your Gemini setup is broken), the others still show up. Failures are isolated.
When an agent spawns subprocesses (Claude Code’s node subagents, for example), aimux groups them. The parent row shows a ×3 badge, and you can expand to see individual child PIDs with box-drawing glyphs. Status icons tell you at a glance what’s happening: green dot for active (activity in the last 30 seconds), hollow dot for idle (waiting for input), half-filled for waiting on a permission prompt.
Cost tracking
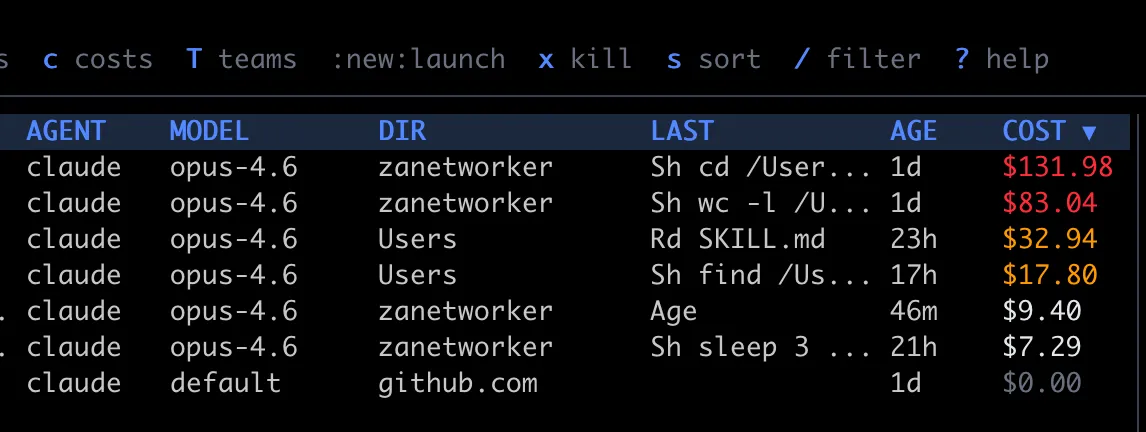
Every agent in the dashboard shows its estimated cost. aimux calculates this from token counts and model pricing at discovery time, so the number is always there and updates every two seconds.
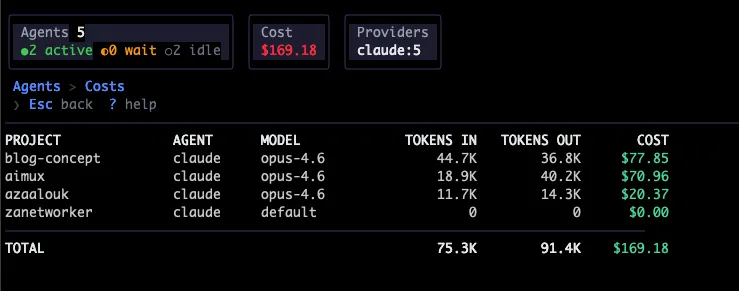
The :costs command opens a dedicated cost dashboard that aggregates spending by project. It shows project name, provider, model, tokens in, tokens out, and estimated USD for each, sorted most expensive first, with a total at the bottom. Costs are color-coded: gray for zero, white under $10, yellow under $50, red above. Per-turn cost also shows up in the trace view, so you can see which individual turns burned money (usually the ones with large context or long tool-call chains).
This came from a real annoyance: running five agents for a day and having no idea what the bill looked like until I checked the API dashboard. Now I just hit :costs and see it broken down by project.
Spawning new agents
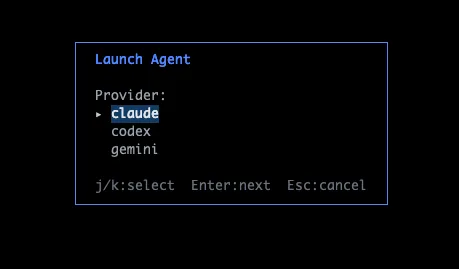
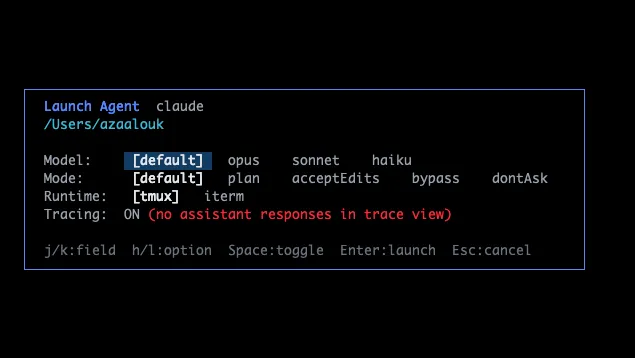
Type :new and aimux opens a launcher overlay. You pick a provider (Claude, Codex, etc.), then a project directory (from a list of recent directories or a file browser), then configure the model, permission mode, and runtime (tmux or iTerm). There’s also a toggle to enable OTEL tracing on the spawned session, which auto-injects the OTEL_EXPORTER_OTLP_ENDPOINT env var so telemetry flows into aimux’s receiver.
The point is to stay in one place. Instead of opening a new terminal, cd-ing to a project, running claude --model opus, and hoping you remember to check back, you just launch from aimux and the new agent shows up in the same dashboard. The flow walks you through each step:
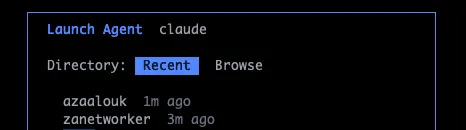
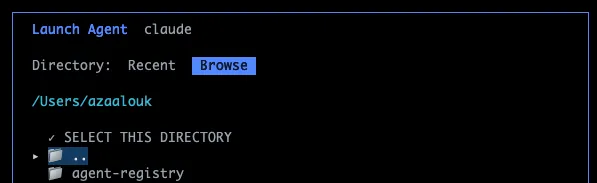
Recent directories are pulled from each provider’s history, so the dirs you’ve been working in are already there.
Agent lifecycle
You can kill agents directly from the dashboard with x (confirmation prompt first). Sort the agent list by name, cost, age, model, or PID with s — useful when you want to see which sessions are burning the most money or which ones have been idle the longest. Filter by name, directory, or model with / to narrow down a crowded list. Jump to top or bottom with g/G.
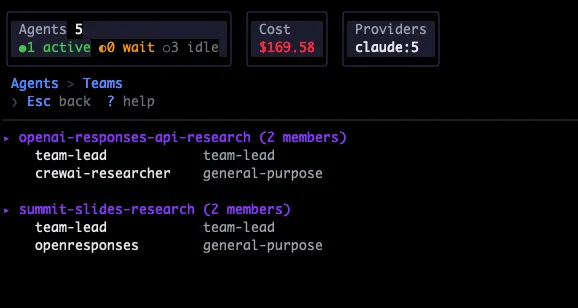
There’s also a :teams view that reads Claude Code’s team configurations from ~/.claude/teams/ and shows team members, useful when running multi-agent team sessions.
The provider interface
Each agent type implements a 10-method Go interface:
type Provider interface {
    Name() string
    Discover() ([]agent.Agent, error)
    ResumeCommand(a agent.Agent) *exec.Cmd
    CanEmbed() bool
    FindSessionFile(a agent.Agent) string
    RecentDirs(max int) []RecentDir
    SpawnCommand(dir, model, mode string) *exec.Cmd
    SpawnArgs() SpawnArgs
    ParseTrace(filePath string) ([]trace.Turn, error)
    OTELEnv(endpoint string) string
}
Want to add aider or Cursor’s CLI? Implement these methods in one file, register the provider. Session rendering is a separate SessionBackend abstraction: Claude Code embeds directly via PTY, Codex and Gemini mirror their tmux sessions.
Tracing, evals, and debugging
This is really the part that made me want to build aimux. Running agents is easy. Understanding what they did, and whether it was any good, is the hard part.
Two trace sources, one view
aimux pulls trace data from two places simultaneously. First, it reads each provider’s native log files: Claude Code’s JSONL, Codex’s conversation files, Gemini’s JSON traces. These give you the full conversation: what the user asked, what the agent said, every tool call with its input and whether it succeeded or failed. Each turn is a Turn struct with user lines, output lines, a list of ToolSpan actions, token counts, cost, and model name.
Second, aimux runs an OpenTelemetry HTTP receiver on port 4318. When you spawn agents through aimux, it automatically sets the OTEL_EXPORTER_OTLP_ENDPOINT env var so agents send telemetry to aimux’s receiver. Claude Code sends events via the OTEL logs protocol (user_prompt, api_request, tool_result), and aimux converts them into its internal span model. This gives you live cost updates and token counts without waiting for log files to flush.
The combination matters: file parsing for rich conversation content, OTEL for real-time visibility. You get both in the same trace view.
Annotations as evaluation data
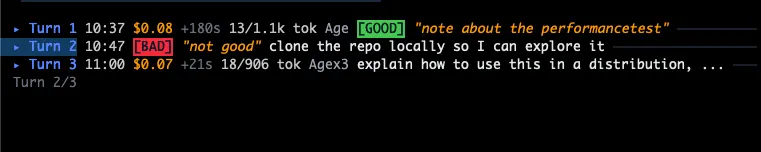
While reading through a trace, press a to cycle a turn’s label through GOOD, BAD, WASTE, or clear. Press N to attach a free-text note explaining why. Annotations are saved as JSONL under ~/.aimux/evaluations/, one file per session.
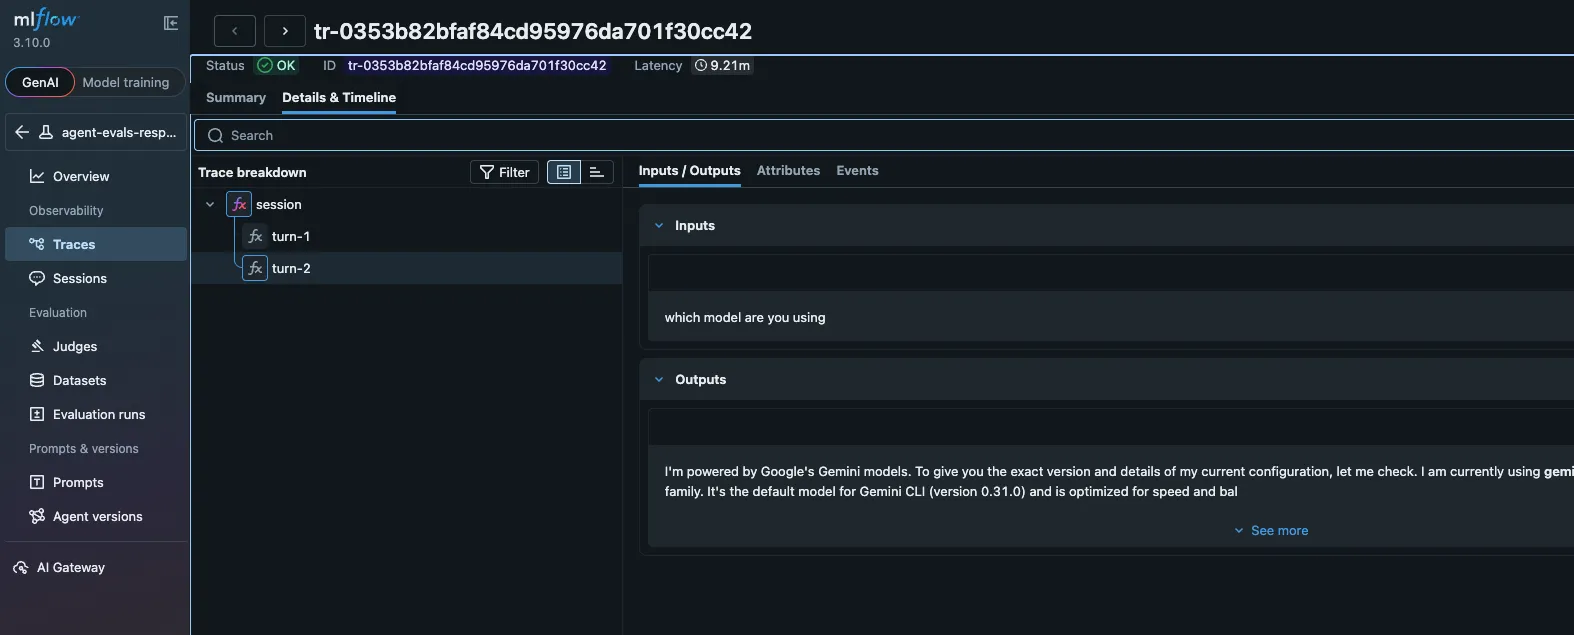
This is where it connects to MLflow. Run :export-otel and aimux constructs a proper OTLP trace: a root session span, child spans for each turn, grandchild spans for each tool call. Annotations become span attributes (aimux.feedback.value, aimux.feedback.rationale). The whole thing ships to whatever OTLP endpoint you’ve configured in ~/.aimux/config.yaml, whether that’s MLflow, Jaeger, or Grafana Tempo.
# ~/.aimux/config.yaml
export:
  endpoint: "localhost:5000"
  insecure: true
  experiment_id: "123"  # MLflow experiment
Once in MLflow, you can select annotated traces, add them to an evaluation dataset, and use them as ground truth to calibrate LLM judges. Run the same task on Opus vs. Sonnet, annotate both, export both, compare BAD rates and cost. The traces carry model name, token counts, and cost, so the comparison is apples-to-apples.
Debugging the pipeline
aimux exposes a /debug endpoint on the OTEL receiver (curl http://localhost:4318/debug). It shows you how many trace and log requests came in, which conversation IDs are stored, and a rolling log of the last 50 HTTP requests. Add ?events=1 to dump all stored spans with their attributes. When an agent’s telemetry isn’t showing up, this is how you figure out why.
There’s also the JSONL export path (e then j in the trace view), which writes enriched turns to ~/.aimux/exports/. Each line is a full ExportTurn with input, output, tool actions, tokens, cost, duration, and any annotation label/note. You can grep through these files, load them in Python, or pipe them into whatever analysis you need.
The containers parallel
I keep thinking about this in terms of containers. Individual containers were useful on their own. But once you had a dozen of them, you needed something to tell you what was running, what was stuck, and what was burning money. That’s how Kubernetes and its ecosystem happened.
We’re getting to a similar place with AI agents. Once the workflow is “spin up three agents, each handles a subtask, check back later,” the question stops being “how do I use an agent” and becomes “how do I keep track of several.” A multiplexer that can aggregate, observe, and let you annotate what’s working and what isn’t.
aimux is what I built for that. Single binary, works with agents you already run, nothing to install on their side.
github.com/zanetworker/aimux - install with
brew install zanetworker/tap/aimuxor build from source.