Product Signal-to-Noise Ratio
Every product is part value (signal) and part overhead (noise); what users feel is the ratio between the two.
Contents
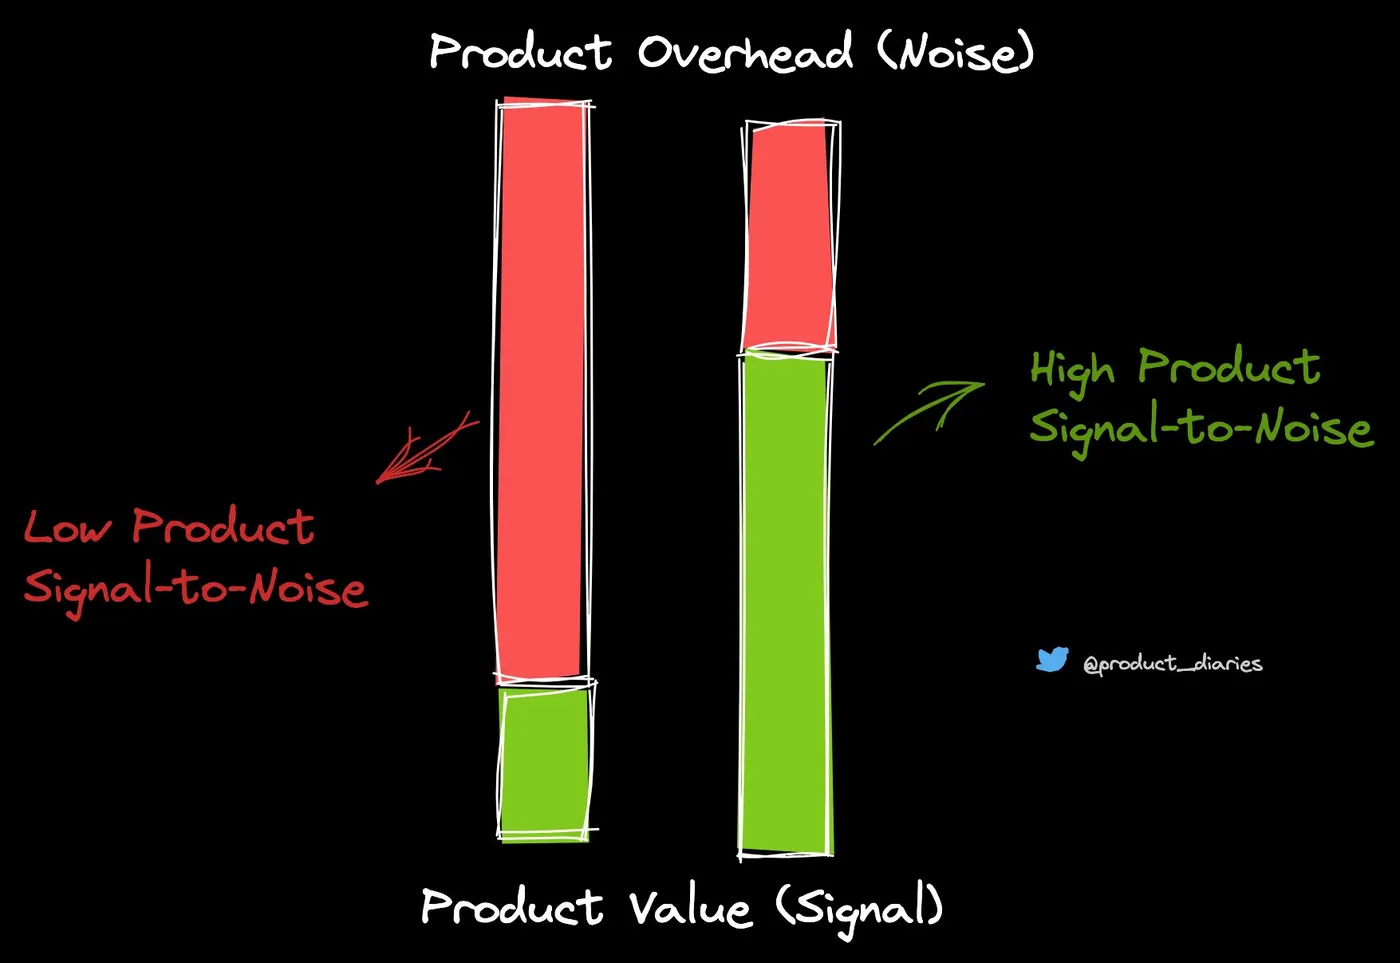
Use it when Reviewing a product or feature and asking how much of what users deal with is value and how much is overhead.
Each bar is one product, split into two parts:
- Product value (signal): the green part.
- Product overhead (noise): the red part on top.
The left product has low product signal-to-noise: most of the bar is overhead and only a thin slice is value. The right product has high product signal-to-noise: most of the bar is value and only a small slice is overhead.
The two bars are about the same height. What separates them is not how big the product is but how much of it is noise. Raising the ratio means growing the signal, shrinking the noise, or both.